fplot
fplot is the function to plot expressions or functions.
fplot(f,<xinterval>)plots the curve defined by the functiony = f(x)over the specified interval for x- default interval
- specify the interval as a two-element vector of the form
[xmin xmax]
fplot(funx,funy,<tinterval>)plots the curve defined byx = funx(t)andy = funy(t)over the specified interval for t- default interval
- specify the interval as a two-element vector of the form
[tmin tmax]
fplot(___,LineSpec)specifies the line style, marker symbol, and line color- or
fplot(___,Name,Value)
- or
Examples
-
Plot Matlab Anonymous Function
fplot(@(x) sin(x)^2 * cos(x))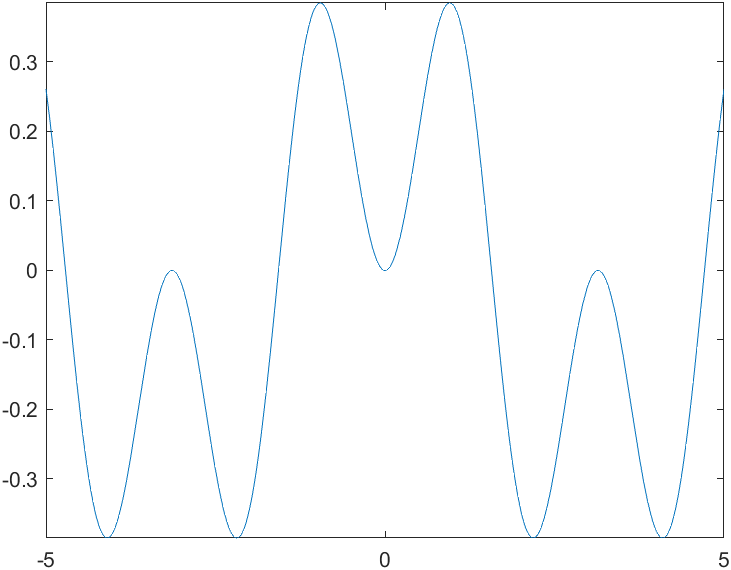
20210728134413 -
Plot Parametric Curve
fplot(@(t) cos(3*t), @(t) sin(2*t))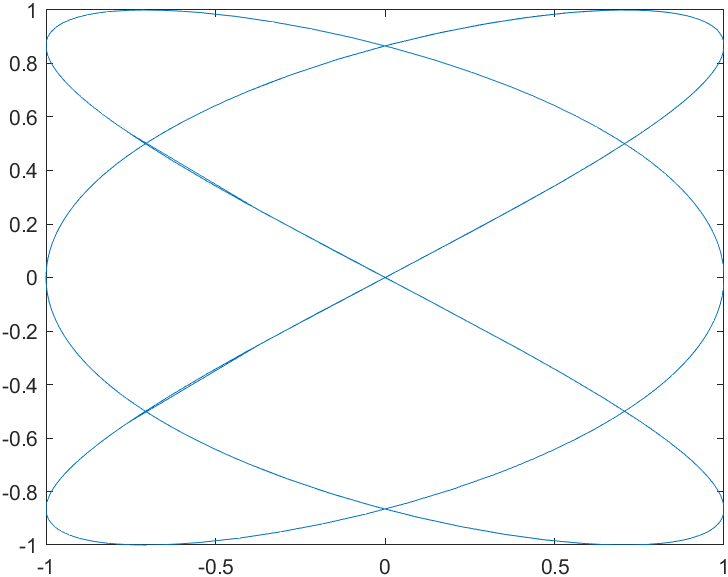
20210728135628 -
Plot Piecewise Functions and Specify Line Properties
fplot(@(x) exp(x), [-3 0], '-b')
hold on
fplot(@(x) cos(x), [0 3], 'LineStyle', ':')
hold off