Matlab Graphics - 3D Plots
Meshgrid
meshgrid is an essential function to create 2D grids of coordinates for 3D plots.
% For existing x and y
[X, Y] = meshgrid(x, y);
% Square grid
[x, y] = meshgrid(-10:0.5:10);
Where:
xis a vector specifying the x-coordinates of the grid points.yis a vector specifying the y-coordinates of the grid points.XandYare output matrices representing the 2D grid of coordinates, whereXholds the x-coordinates of each point in the grid, andYholds the y-coordinates of each point in the grid.
Plots
surf & mesh
% Create a grid of x and y values
[x, y] = meshgrid(-10:0.5:10);

% Compute z values using the function
z = sin(sqrt(x.^2 + y.^2));

% Create a figure and plot the surface
f = figure;
% surf(x, y, z);
% mesh(x, y, z);
contour(x, y, z);

% Add labels and title
xlabel('X-axis');
ylabel('Y-axis');
zlabel('Z-axis');
title('Surface Plot of z = sin(sqrt(x^2 + y^2))');
waitfor(f)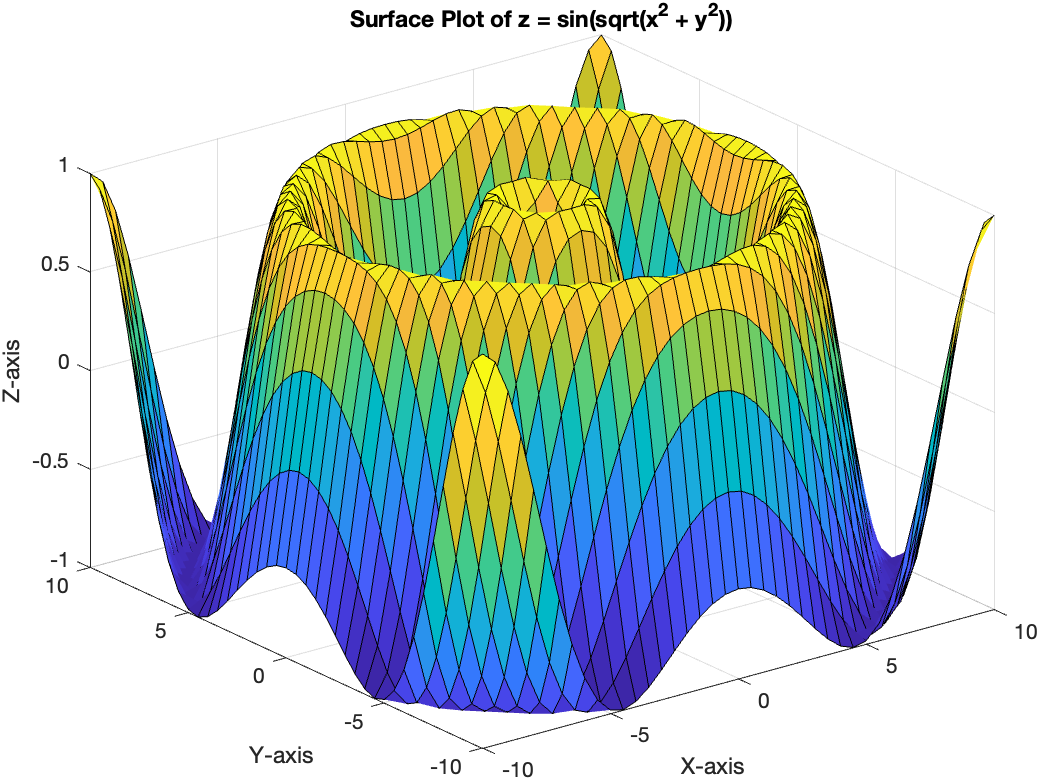
- Notice that the data function should use element-wise operations
scatter3
A scatter3 plot is used to visualize individual data points in 3D space. Let’s create a scatter3 plot for randomly generated data points.
% Generate random data
n = 100;
x = randn(n, 1);
y = randn(n, 1);
z = randn(n, 1);

% Create a figure and plot the scatter points
figure;
scatter3(x, y, z, 'filled', 'MarkerFaceColor', 'b');

% Add labels and title
xlabel('X-axis');
ylabel('Y-axis');
zlabel('Z-axis');
title('Scatter3 Plot of Random Data Points');
View
In MATLAB, you can copy the rotation status of a 3D graph (e.g., a 3D plot or a mesh plot) from one figure to another using the view function. The view function allows you to set the azimuth and elevation angles, which control the rotation status of the 3D graph.
% Set the desired view angles for the 3D graph in the first figure
azimuth = 30;
elevation = 25;
view(azimuth, elevation);

% Get the current view angles from the first figure
[azimuth, elevation] = view;