Graph Color
Link Between Data And Color
Match data types to color palettes/schemes
- Sequential ^1dc7c8
- suitable for ordinal variables
- easy to tell the level of a color
- e.g. Heatmap
- Diverging
- suitable for Likert Data
- able to divide colors into groups
- Qualitative
- suitable for Categorical Data
- There should not be some colors that stand out more than other colors
- Unless you are stressing certain values
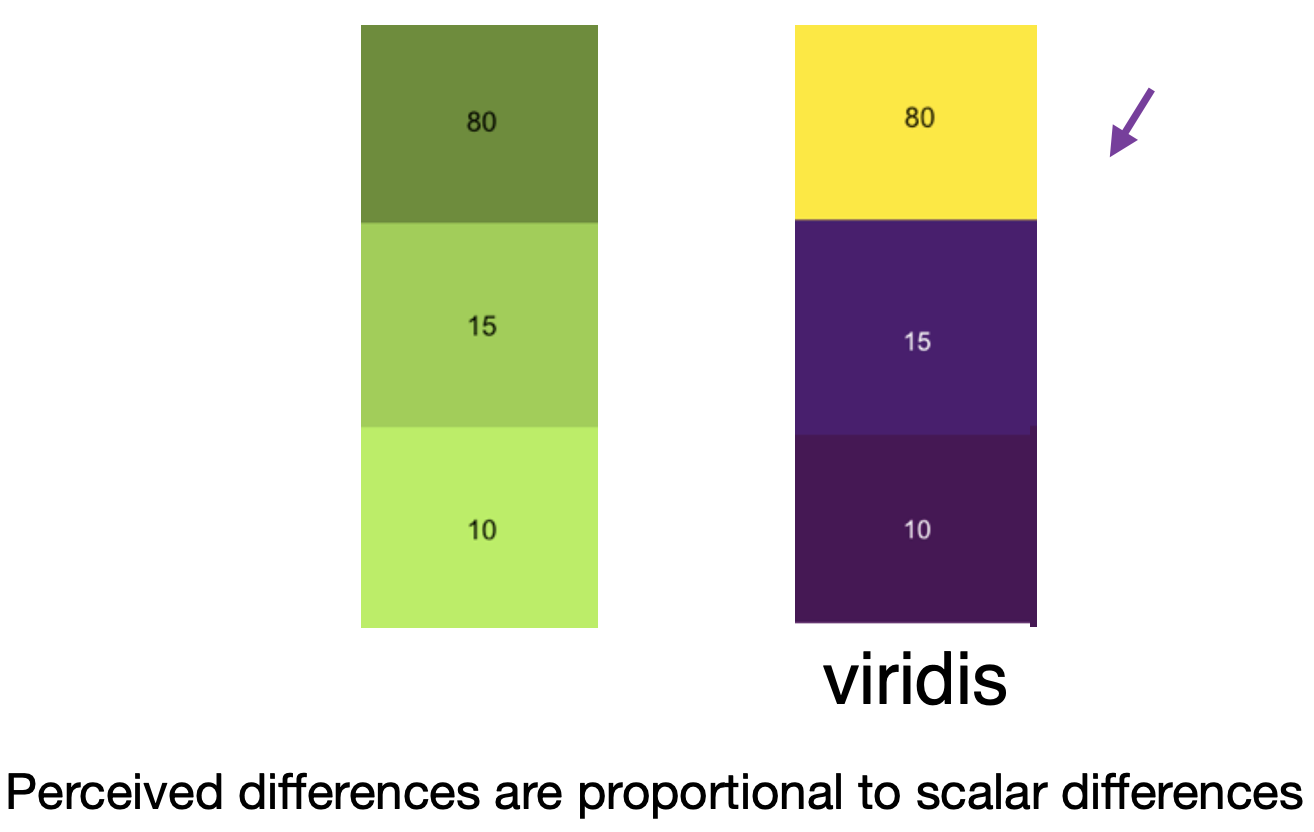
Perceptually Uniform Color Spaces
We want to perceive the difference between data by observing colors.
Distinctions In Data
- The rate of color change should be consistent
- This is also required by perceptually uniformness
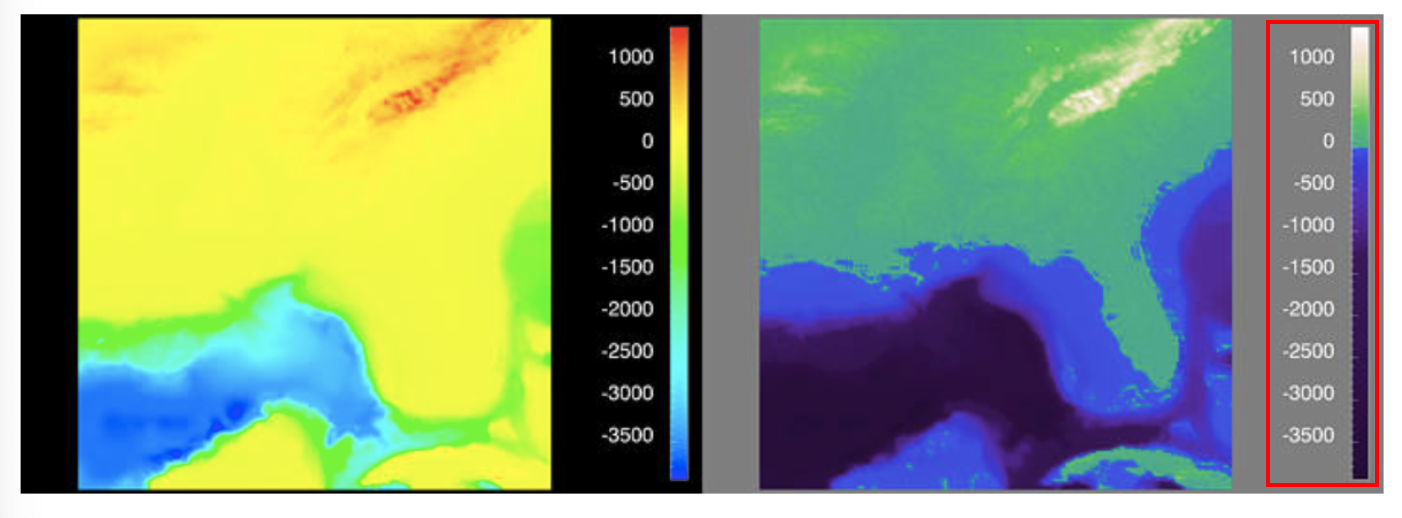
- Color scheme
rainbowis not perceptually uniform
- Large range
- the color range should be large enough to help distinguish differences
- Sharp break at important thresholds
With ggplot2
- Continuous data
- scheme function:
+scale_color_viridis_c()(cfor continuous) - palette option:
+scale_color_distiller(palette = "PuBu") - own sequential:
+scale_color_gradient(low="white", hight="red") - own diverging:
+scale_color_gradient2(low="blue", mid="white", hight="red")
- scheme function:
- Discrete data
- scheme function:
+scale_color_viridis_d()(dfor discrete) - palette option:
+scale_color_brewer(palette = "PuBu") - own:
+scale_color_manual(values=c("red", "yellow", "#FFFFFF")
- scheme function:
- The
colorin the above scales can befillfor scaling thefillvariable - continuous vs discrete:
cvsv,distillervsbrewer,gradientvsmanual
With Other Packages
library(RColorBrewer)
colors <- brew.pal(4, "Reds") # get the color codes
barplot(1:4,  col = colors)
Color Vision Deficiency
To make color vision deficiency (CVD) friendly graphs,
- Use palettes that have already been tested
- viridis,
scale_color_colorblind()in ggthemes
- viridis,
- Use a color vision deficiency simulator
- Color Oracle
- Use high contrast
General Tips
- Be consistent with colors
- the color of the same object should be consistent among different graphs
- manually set up the color if needed
- Legend order matches graph order
- If your legend is on the right, it better matches the right ends of the graph
- try label instead of legend
- for some plots, like Bar Plot, legends at the bottom may be better
- Sequential scheme for Continuous Data; qualitative scheme for Categorical Data
- Do not use diverging scheme for non-likert data
- Colors should be a separate dimension
- if a variable is already presented along the x-axis, there is no need to color the variable