Continuous Variable
A continuous variable can in theory take any value over its range, as opposed to a discrete variable.
- The real world is discrete: in practice data for continuous variables are generally rounded to some level of measurement accuracy.
Features of Continuous Variables
- Asymmetry
- the distribution may not be symmetric like Normal Distribution
- the distribution may be skewed to the left or right
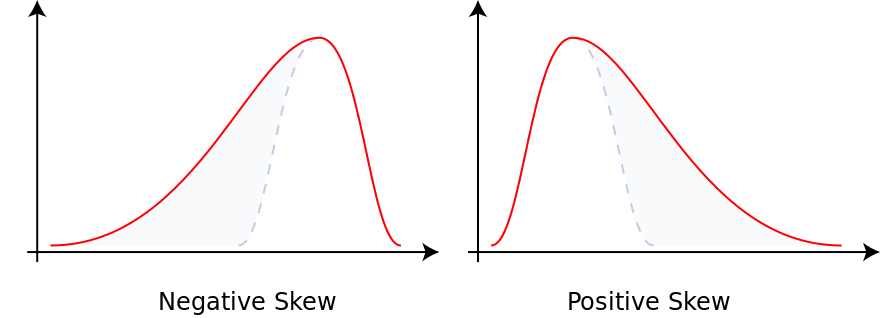
- A distribution is called skewed left/negative if, as in the distribution graph, the left tail (smaller values) is much longer than the right tail (larger values)
- A distribution is called skewed right/positive if, as in the distribution graph, the right tail (larger values) is much longer than the left tail (smaller values)
- distributions of income
- Outliers
- there may be data far from the rest of the data
- Multimodality
- the distribution may have more than one peak
- the mode is the value that appears most often in a set of data values
- For a discrete Random Variable, the mode is
- For a continuous Random Variable, the mode is the local maxima of the PDF
- Gaps
- There may be ranges of values within the data where no cases are recorded
- Heaping
- some values may occur unexpectedly often
- Rounding
- Only certain round values (like integers) are found
- Errors/Impossibilities
Different graphs emphasize different features.
Graphs
- Histogram
- asymmetry
- multimodality
- gaps
- heaping
- rounding
- Boxplot
- outliers
- statistics
- ❌ multimodality
- Density Curve
- distribution
- asymmetry
- multimodality
- ❌ gaps
- ❌ heaping
- Ridgeline
- Bar Chart
- gaps, heaping
- treating discrete values as Categorical Data
- Cleveland Dot Plot
- gaps
- heaping
- Q-Q Plot
- distribution
- asymmetry
- multimodality
Combine Continuous Variables and Categorical Variables
Combine Continuous Variables and Categorical Variables
When combining Continuous Variables and Categorical Variables, we should consider
Link to original
- mapping options:
- Continuous: x-axis, y-axis, color (not so great), size (not so great)
- Categorical: color, facets (rows, columns), shape (maybe)
- Add one variable at a time
- Create more graphs if suitable options run out
- Switch options to test