Line Plots
Line plots are the most basic graph in MATLAB; their class is matlab.graphics.chart.primitive.Line.
Functions
- 2-D: plot
- 3-D:
plot3, same usage as plot - Log scale:
loglog, same usage as plot, but the axes use a log scale - Polar:
polarplot, same usage as plot
Line Properties
Line properties control the appearance and behavior of a Line object and are stored as a structure. Storing a plot as an object in a variable lets you inspect and edit each property:
p =

  Line with properties:

              Color: [0 0.4470 0.7410]
          LineStyle: '-'
          LineWidth: 0.5000
             Marker: 'o'
         MarkerSize: 15
    MarkerFaceColor: 'none'
              XData: [1x501 double]
              YData: [1x501 double]
              ZData: [1x501 double]

  Use GET to show all properties
A few common properties follow.
Line
Line Color
- Field name:
.Color - Default:
[0 0 0] - Inputs:
| Color Name | Short Name | RGB Triplet | Hex Color Code |
|---|---|---|---|
'red' | 'r' | [1 0 0] | '#FF0000' |
'green' | 'g' | [0 1 0] | '#00FF00' |
'blue' | 'b' | [0 0 1] | '#0000FF' |
'cyan' | 'c' | [0 1 1] | '#00FFFF' |
'magenta' | 'm' | [1 0 1] | '#FF00FF' |
'yellow' | 'y' | [1 1 0] | '#FFFF00' |
'black' | 'k' | [0 0 0] | '#000000' |
'white' | 'w' | [1 1 1] | '#FFFFFF' |
'none' | Not applicable | Not applicable | Not applicable |
Line Style
- Field name:
.LineStyle - Default:
'-' - Inputs:
| Line Style | Description |
|---|---|
'-' | Solid line |
'--' | Dashed line |
':' | Dotted line |
'-.' | Dash-dotted line |
'none' | No line |
Line Width
- Field name:
.LineWidth - Default:
0.5 - Inputs: numeric
Markers
Marker Symbol
- Field name:
.Marker - Default:
'none' - Inputs:
| Value | Description |
|---|---|
'o' | Circle |
'+' | Plus sign |
'*' | Asterisk |
'.' | Point |
'x' | Cross |
'_' | Horizontal line |
' | ' |
'square' or 's' | Square |
'diamond' or 'd' | Diamond |
'^' | Upward-pointing triangle |
'v' | Downward-pointing triangle |
'>' | Right-pointing triangle |
'<' | Left-pointing triangle |
'pentagram' or 'p' | Five-pointed star (pentagram) |
'hexagram' or 'h' | Six-pointed star (hexagram) |
'none' | No markers |
Marker Size
- Field name:
.MarkerSize - Default: 6
- Inputs: numeric
Marker Outline Color
- Field name:
.MarkerEdgeColor - Default:
'auto'(same as.Color) - Inputs: same as Line Color
Marker Fill Color
- Field name:
.MarkerFaceColor - Default:
'none' - Inputs: same as Line Color
Examples
2-D
% Generate some data using the besselj function
x = 0:0.2:10;
y0 = besselj(0,x);
y1 = besselj(1,x);
y2 = besselj(2,x);
y3 = besselj(3,x);
% Plot the lines from the Bessel functions using standard line styles
figure
plot(x, y0, 'r-', x, y1, 'g--', x, y2, 'b:', x, y3, 'k-.')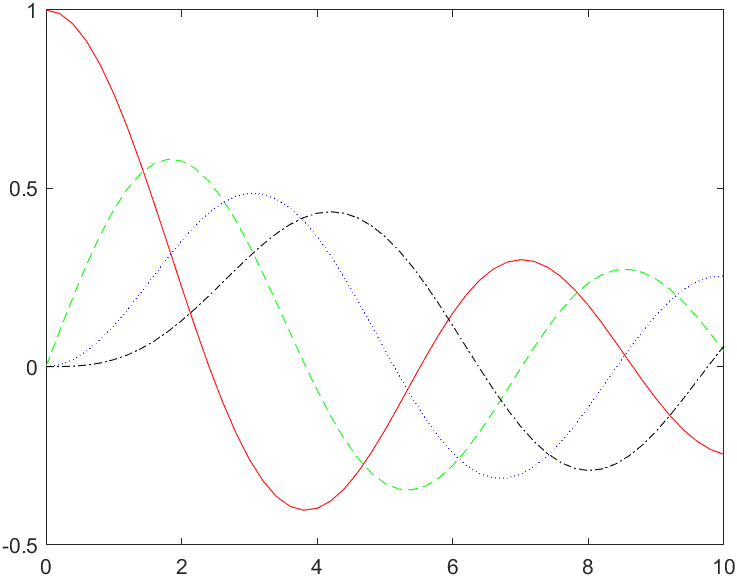
3-D
t = 0:pi/500:pi;
xt1 = sin(t).*cos(10*t);
yt1 = sin(t).*sin(10*t);
xt2 = sin(t).*cos(12*t);
yt2 = sin(t).*sin(12*t);
zt = cos(t);
plot3(xt1, yt1, zt, xt2, yt2, zt)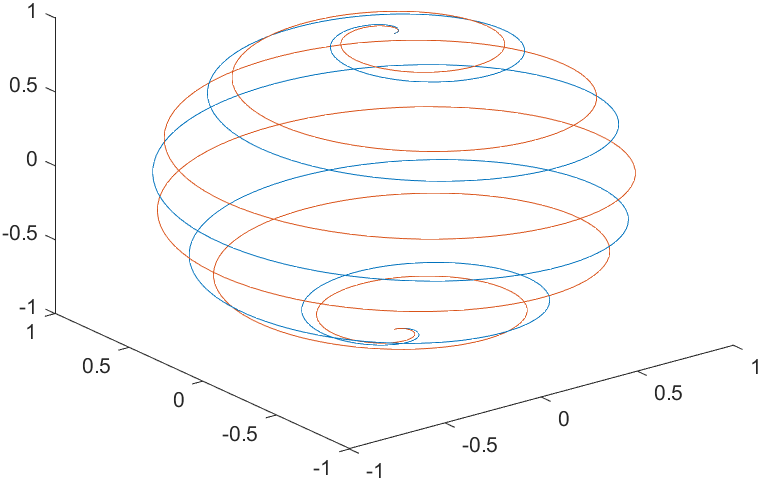
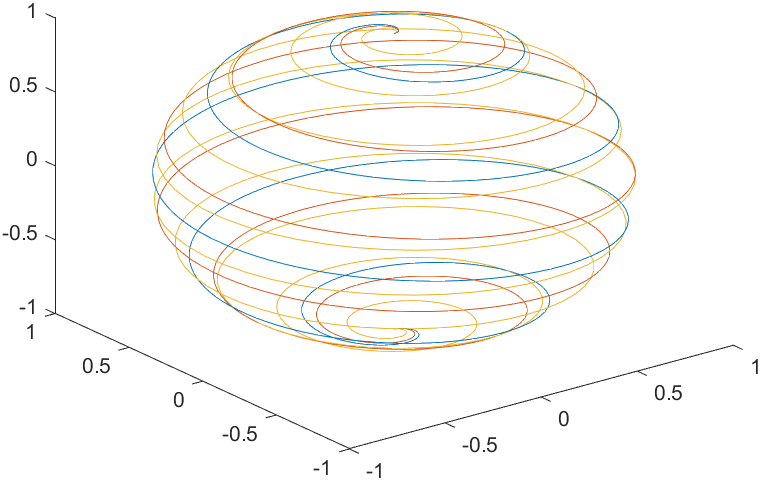
t = 0:pi/500:pi;
X(1,:) = sin(t).*cos(10*t);
X(2,:) = sin(t).*cos(12*t);
X(3,:) = sin(t).*cos(20*t);
Y(1,:) = sin(t).*sin(10*t);
Y(2,:) = sin(t).*sin(12*t);
Y(3,:) = sin(t).*sin(20*t);
Z = cos(t);
plot3(X,Y,Z)