Scatterplot Matrix
If we want to show the relationships between variables using Scatterplots, we need scatterplots. If we plot and as two different plots, then we have plots. Then adding labels, we have a scatterplot matrix.
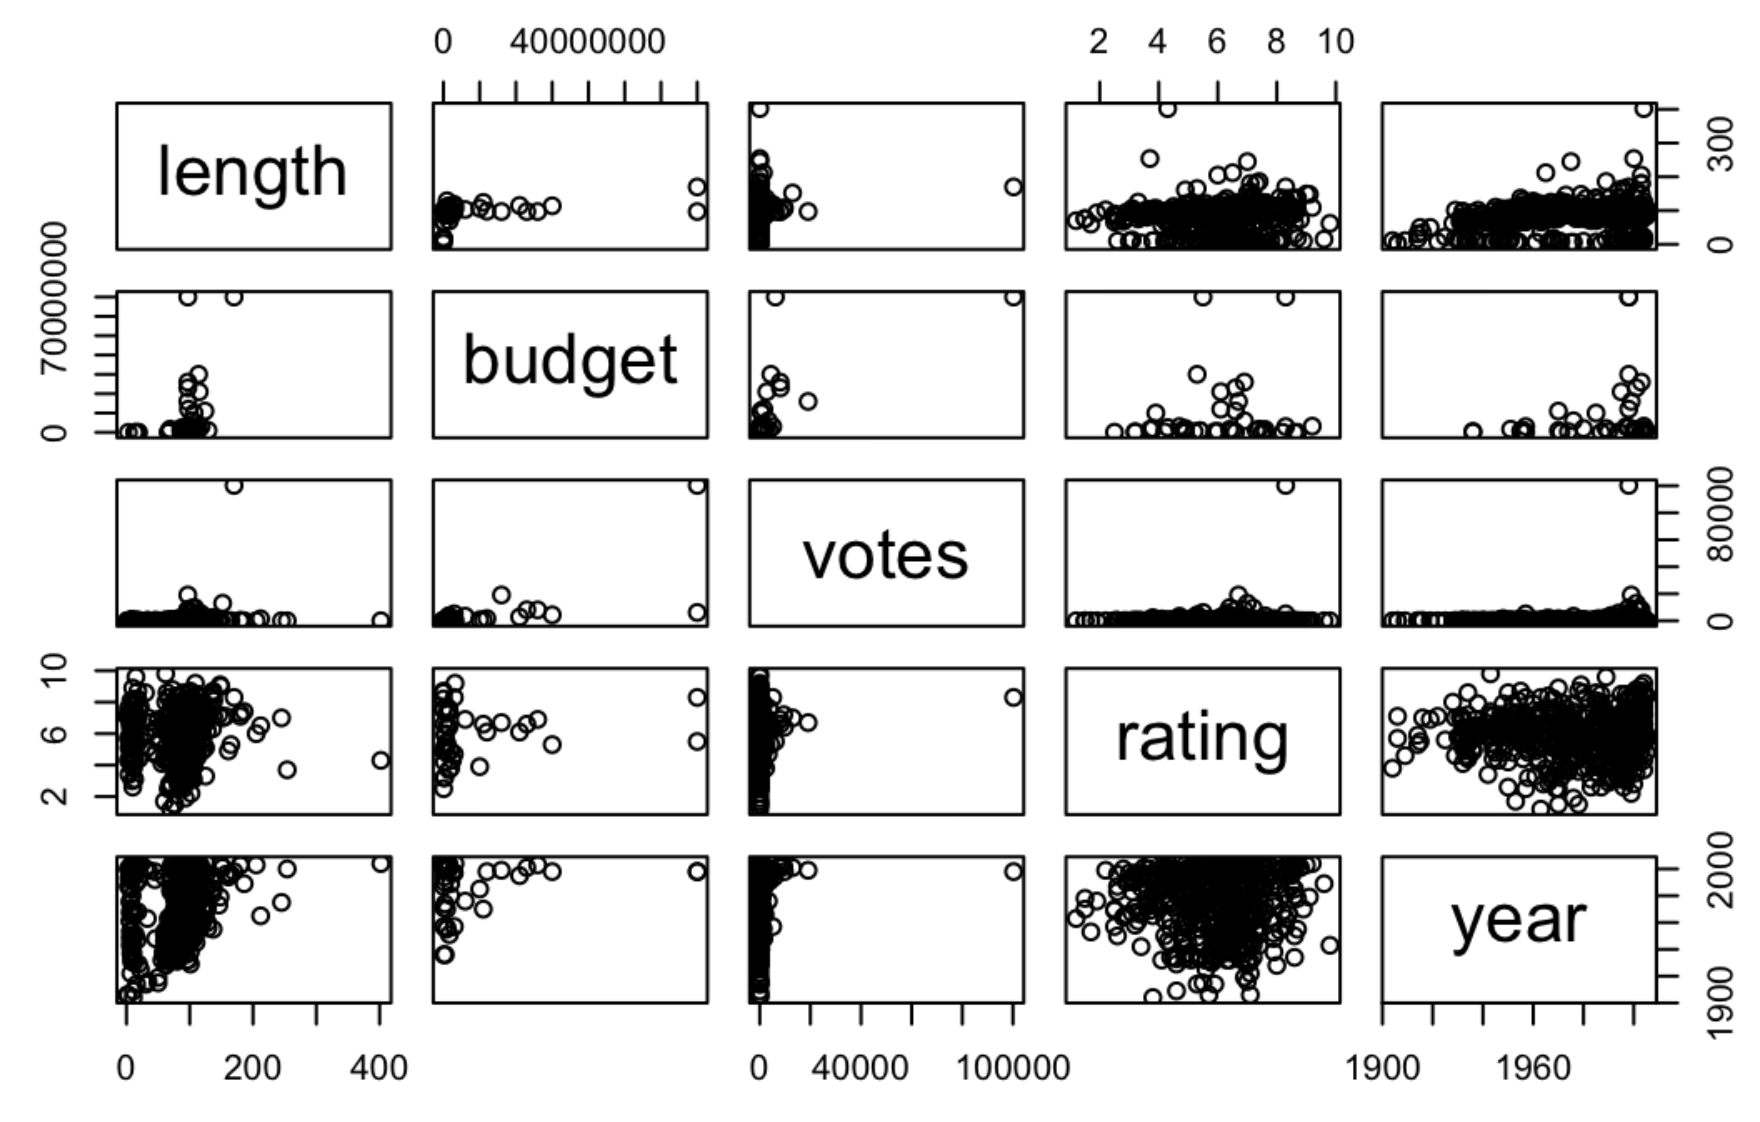
- When passing multiple variables to the R built-in function
plot, it will create a scatterplot matrix. - While this is quite useful for personal exploration of a dataset, it is not recommended for presentation purposes. Something called the Hermann grid illusion makes this plot very difficult to examine.
Other implementations
ggpairs()inGGallysplom()inlattice