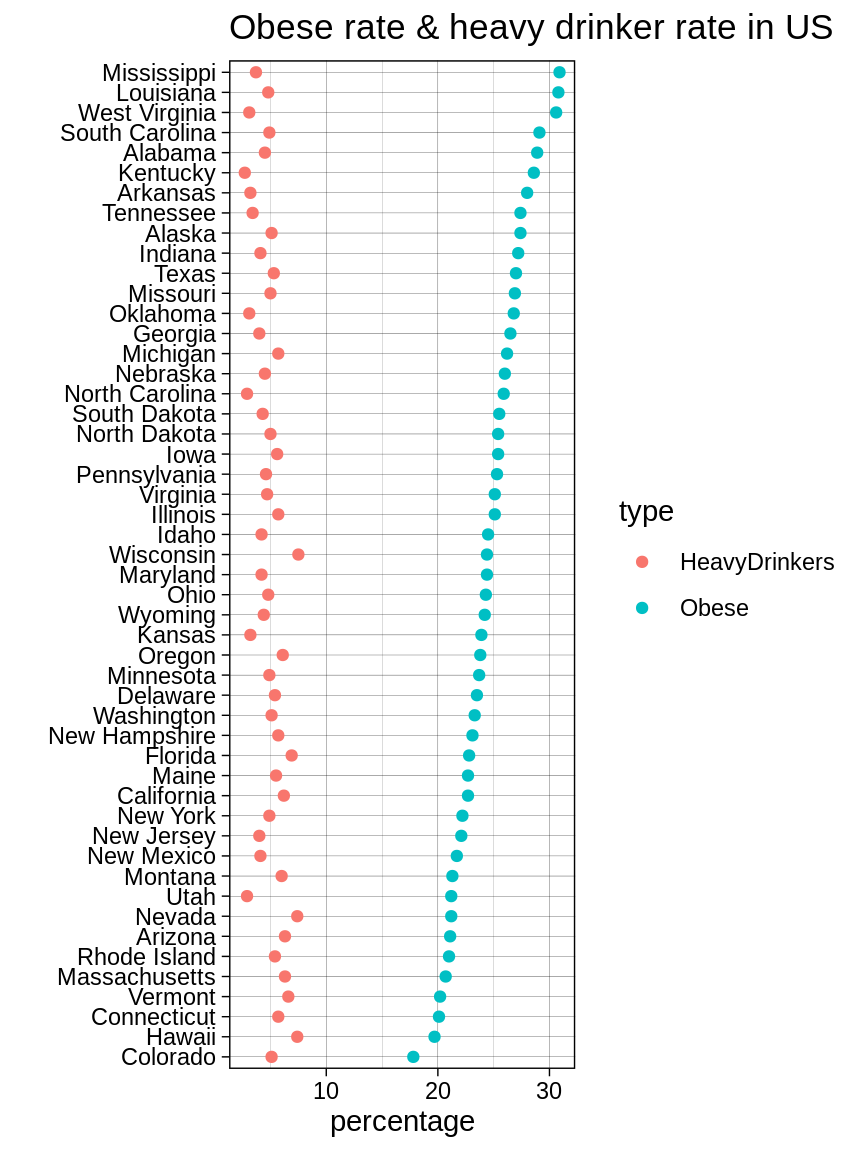
Cleveland Dot Plot
The Cleveland dot plot is an alternative to Bar Chart, replacing a bar with a single dot.
- Cleveland dot plots need to be sorted in descending order just like Bar Charts
- Use
fct_reorderin forcats
- Use
- Use
geom_pointin ggplot2 to create a Cleveland dot plot - When you have other variables other than the categorical variable, Cleveland dot plots can easily adopt multiple dots
- Use
fct_reorder2in forcats to reorder dots based on one variable
- Use
- Facets, the reasonable cut, and other techniques for EDAV - Categorical Data apply to Cleveland dot plots