Density Contour Plot
Density contour lines are two-dimensional Density Curves. So the relationship between density contour lines and Heatmaps is like that between Density Curves and Histograms.
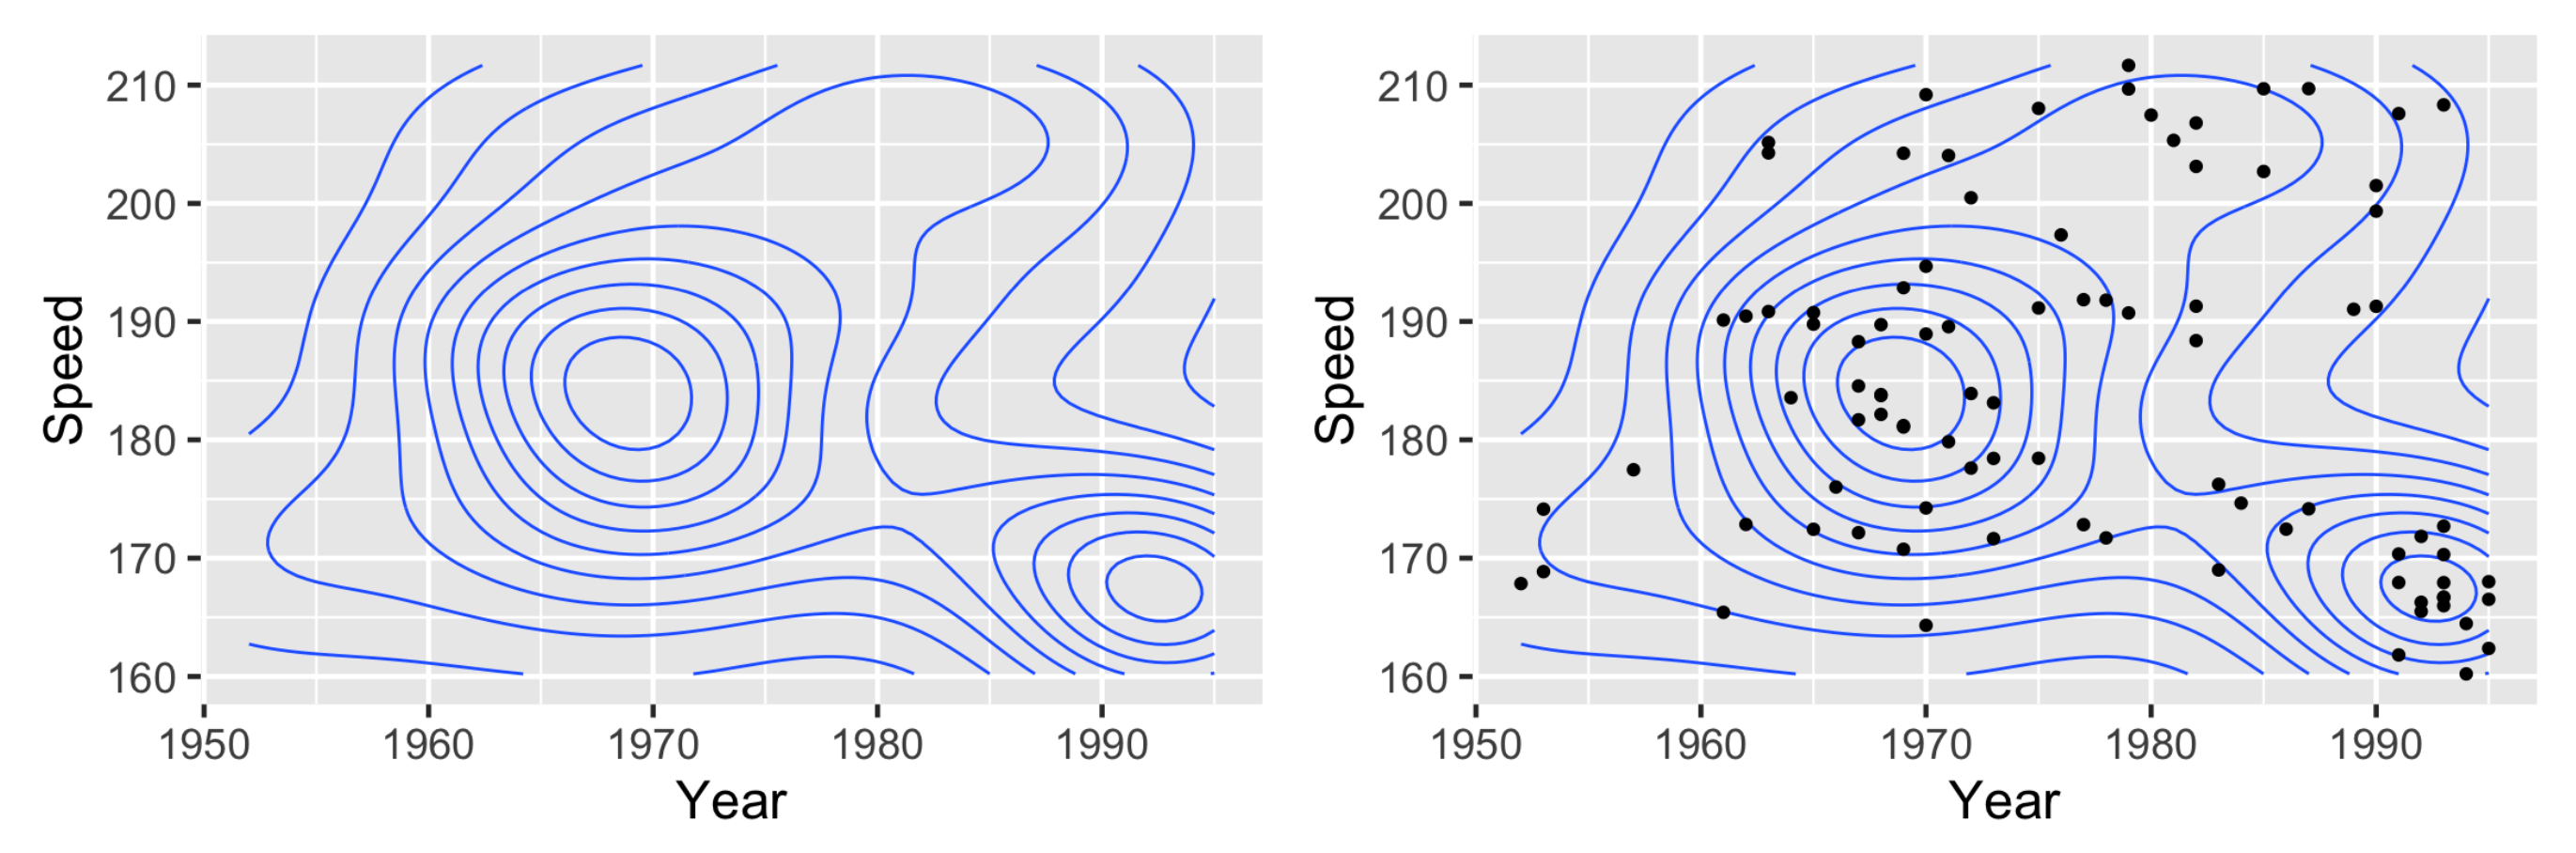
Density contour plots use kernel density estimates to calculate the curves.
- The “number of bins” in a density contour plot is the number of lines
- When using facets, watch out for the boundaries
- clustered points may be separated into two facets, causing wrong density estimates for two facets
Implementation
kde2din packageMASS
library(GDAdata)
library(MASS)
f1 <- kde2d(SpeedSki$Year, SpeedSki$Speed, n = 100)
image(f1)
contour(f1, add = T)geom_density_2d()andgeom_density_2d_filled()in ggplot2
library(GDAdata)
ggplot(SpeedSki, aes(Year, Speed)) +
    geom_density_2d() +
geom_density_2d_filled(alpha = 0.7)- Calculate using
kde2d, plot withgeom_contourin ggplot2
ggplot(con2tr(f1, aes(x, y)) + geom_contour(aes(z = z))